This page shows how you can
- create images of function plots using the plotting tool given below,
- save the plot images in your file-space, and
- insert the images from file-space into any content you edit.
Exclude node summary :
n

x^2
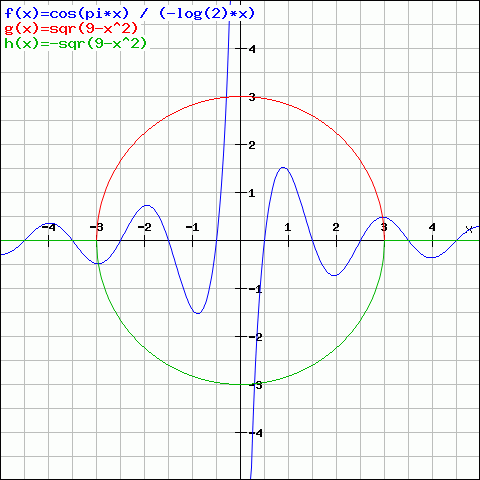
The above plot image has been created by plotting 3 functions -
- f(x) = cos(pi*x)/(-log(2)*x)
- g(x) = sqr(9-x^2)
- h(x) = - sqr(9-x^2)
Introduction
The function plotter is an embedded tool that appears when you are creating or editing a Plot page. The plotter appears with its separate toolbar below the main content. You can plot 3 items simultaneously. These items could be functions, derivatives of functions or integrals of functions.
Two modes
There are two main ways to use it, which are related to its two modes (see toolbar) -
- create plots and save the images for inserting them later in your content, (Form Mode)
- write tutorials with step-by-step notes for learners to read, reproduce plots and try new things (Note Mode)
Plot properties
While the Note Mode is suitable for instructions, the Form Mode gives more control. For example,
- Plot range and plot style for each of the 3 items can be set independently.
- Modify display properties, choose different types of X- and Y-axis scales. (Choose which quadrant to show.)
- Save plot in 3 image formats - GIF, JPG or PNG. (The images are saved in your file-space under "plots" folder.)


 ||Message]
